Live on Chrome Web Store · v1.1.4
Read any chart.
Instantly.
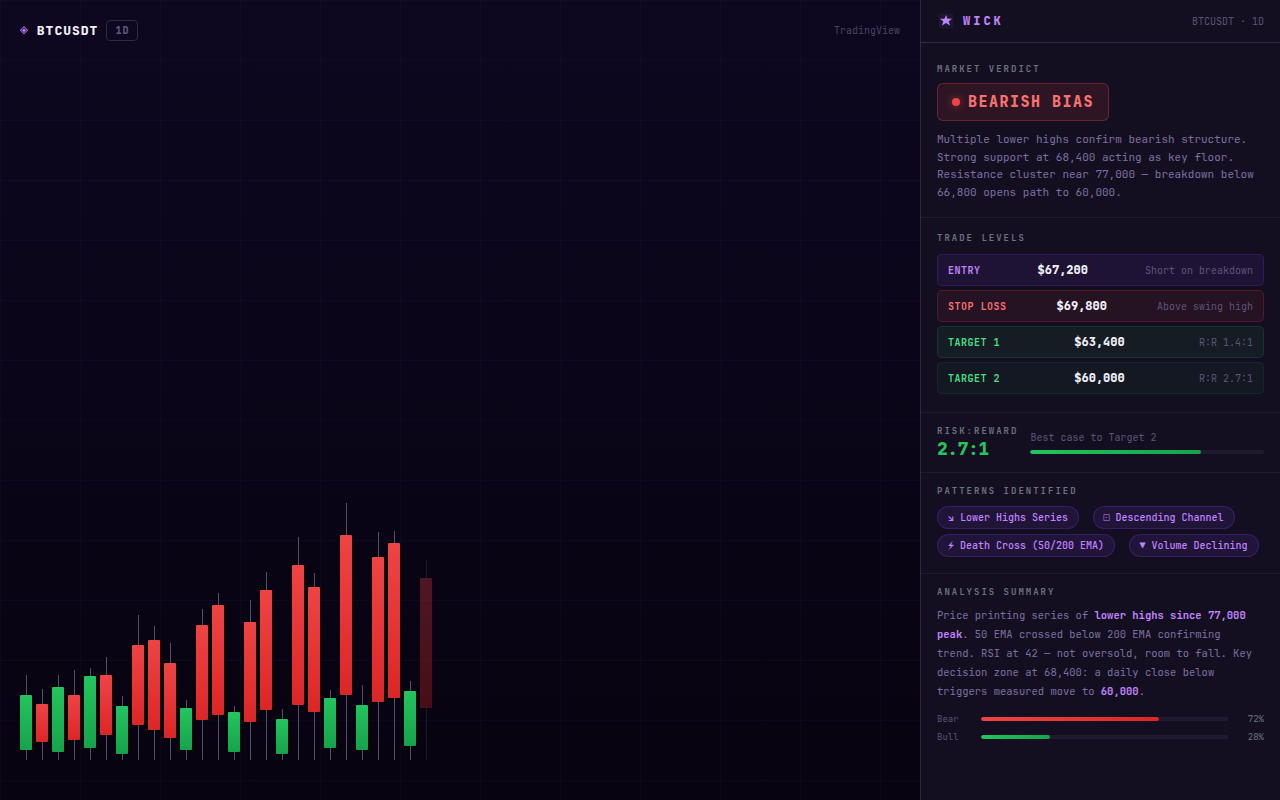
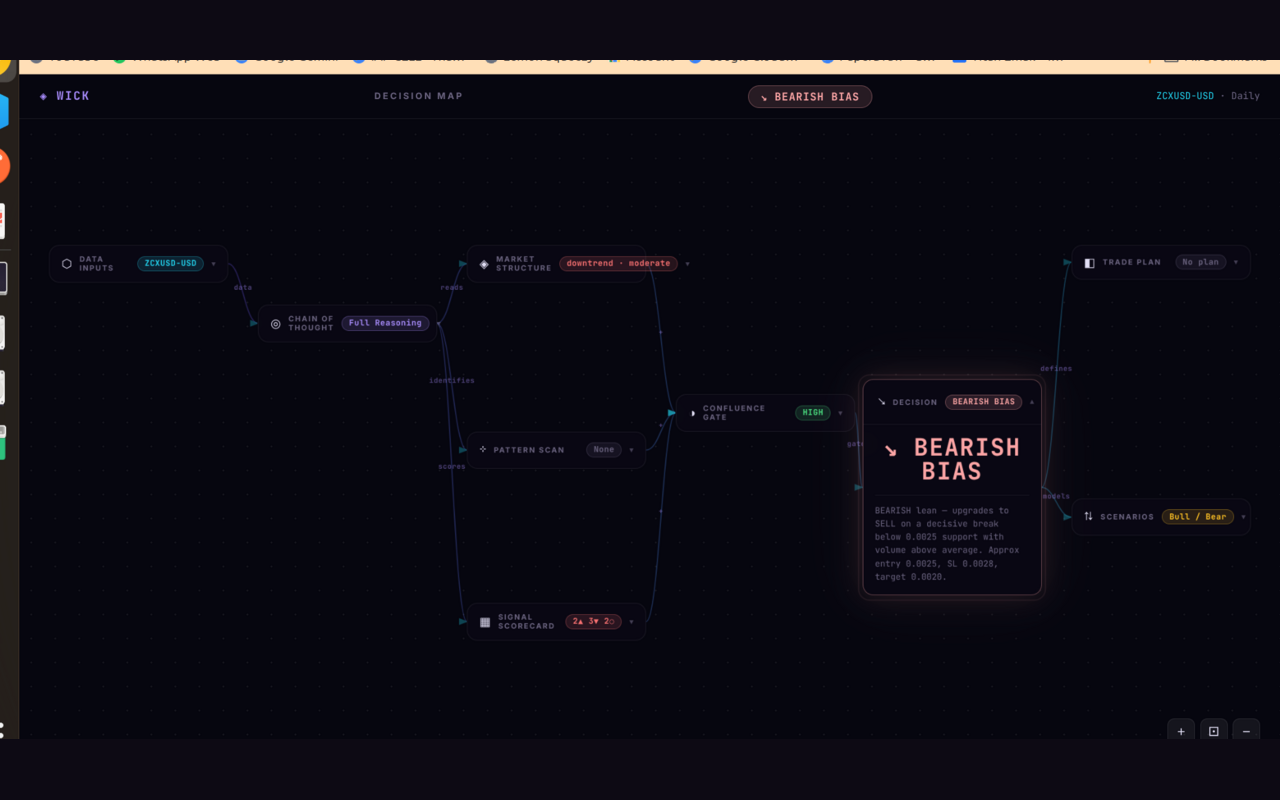
Wick screenshots any candlestick chart in your browser and combines it with live price data to return a full trade plan: entry, stop loss, targets, and R:R in under 5 seconds.
⚡ 7-day free trial
🔒 No login required
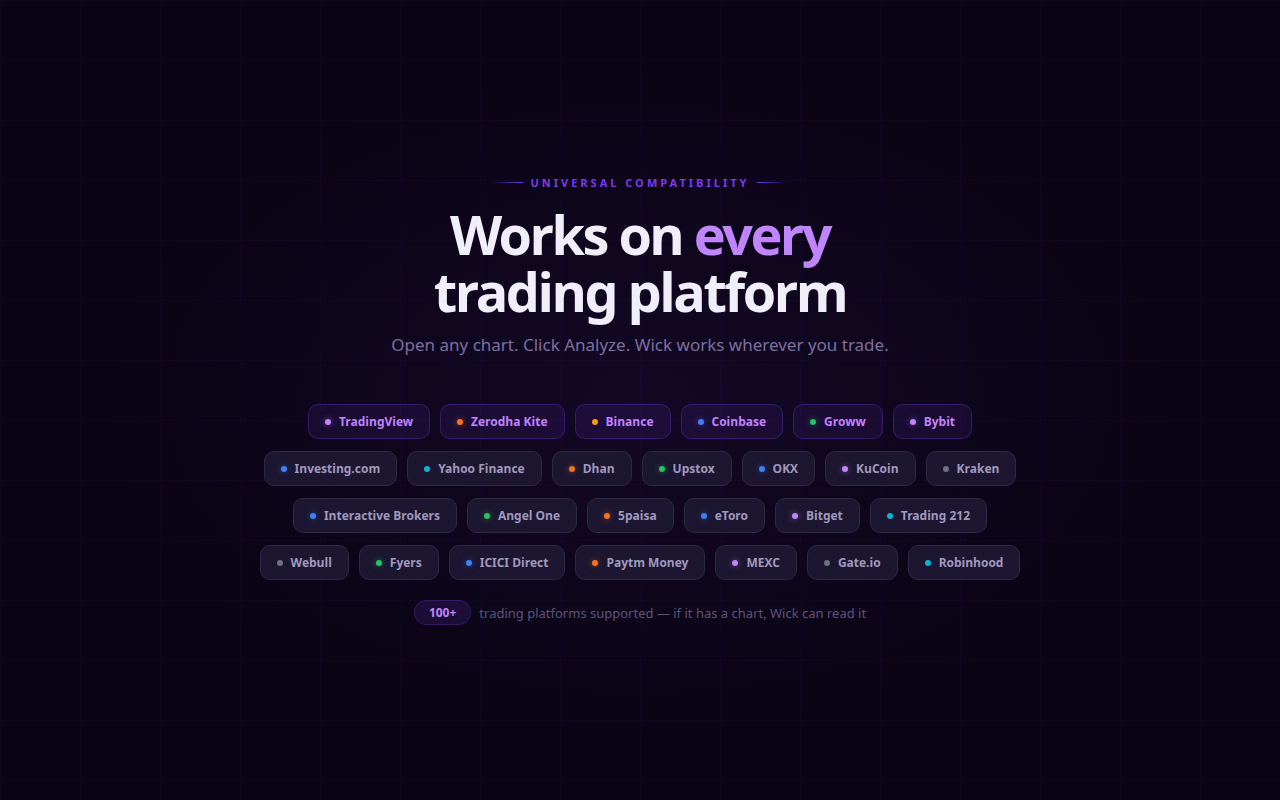
📊 100+ platforms